Wave Detector
Wave Detector
-
class
best.feature_extraction.WaveDetector.WaveDetector(fs, cutoff_low=0.5, cutoff_high=4)¶ A generic wave detector - WaveDetector object detects minimums and maximums of waves in a given frequency bandpass. Designed mainly to detect slow (delta - 0.5 - 4 Hz) waves. WaveDetector can also return statistical report of detected waves such as Δt, slope, peak2peak and min and max values.
Designed for Delta wave detection. Can be deployed on any frequency range.
Example
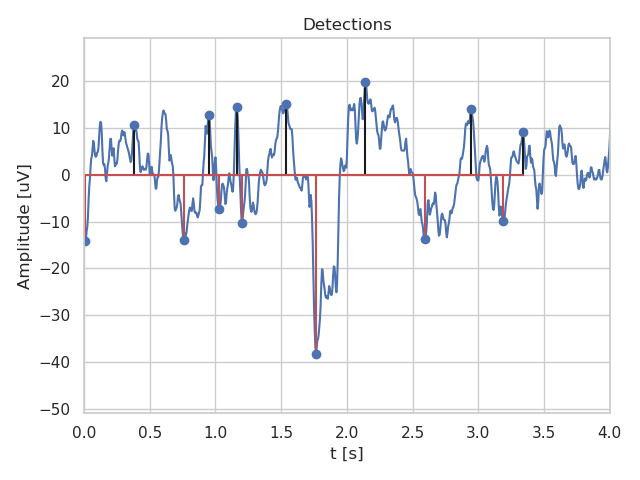
import numpy as np
import matplotlib.pyplot as plt
from sleep_classification.WaveDetector import WaveDetector

fs = 200
signal_length = 5 # s
wave_freq1 = 2
wave_freq2 = 1
noise_level = 0.5

t = np.arange(0, signal_length * fs) / fs
noise = np.random.randn(t.shape[0]) * noise_level
x1 = np.sin(2*np.pi * wave_freq1 * t)
x2 = np.sin(2*np.pi * wave_freq2 * t) * 0.5
x_noise = x1 + x2 + noise

WDet = WaveDetector(fs=fs, cutoff_low=0.5, cutoff_high=4)

stats, det = WDet(x_noise)
min_pos = det['min_pos']
min_val = det['min_val']
max_pos = det['max_pos']
max_val = det['max_val']

#plt.plot(t, x_noise)
#plt.xlabel('t [s]')
#plt.title('Original')
#plt.show()

plt.plot(t, x_noise)
plt.stem(t[min_pos], min_val, 'r')
plt.stem(t[max_pos], max_val, 'k')
plt.title('Detections')
plt.show()

print('Slope Stats')
print(stats['slope_stats'])

print('Peak2Peak Stats')
print(stats['pk2pk_stats'])

print('delta_t Stats')
print(stats['delta_t_stats'])
-
classmethod
delta_t_stats(min_pos=None, min_vals=None, max_pos=None, max_vals=None, fs=None)
-
detect_waves(X)
-
classmethod
max_stats(min_pos=None, min_vals=None, max_pos=None, max_vals=None, fs=None)
-
classmethod
min_stats(min_pos=None, min_vals=None, max_pos=None, max_vals=None, fs=None)
-
classmethod
pk2pk_stats(min_pos=None, min_vals=None, max_pos=None, max_vals=None, fs=None)
-
classmethod
slope_stats(min_pos=None, min_vals=None, max_pos=None, max_vals=None, fs=None)
-
static
stat(X)
-
classmethod
-
best.feature_extraction.WaveDetector.slow_wave_detect(data, fs, max_distance, min_distance, amplitude_threshold, pdf_path, sleep_state, epoch_number, slow_waves_to_remove=None, time_threshold=None, verbose=True)¶ The code is based on the following publication and extends and improves the features and methods of original
wave detections from the paper:
Riedner, B. a., Vyazovskiy, V. V., Huber, R., Massimini, M., Esser, S., Murphy, M., & Tononi, G. (2007).
Sleep homeostasis and cortical synchronization: III. A high-density EEG study of sleep slow waves in humans. Sleep, 30(12), 1643–1657.
Parameters: data (array-like): Input EEG data. fs (float): Sampling frequency of the data. max_distance (float): Maximum distance between zero crossings for a valid slow wave. min_distance (float): Minimum distance between zero crossings for a valid slow wave. amplitude_threshold (float): Minimum amplitude for a valid slow wave. pdf_path (str): Path to save the plot as a PDF. sleep_state (str): Current sleep state. epoch_number (int): Current epoch number. slow_waves_to_remove (list, optional): List of slow waves to remove. time_threshold (float, optional): Time threshold for removing slow waves. verbose (bool, optional): If True, plot the results. Default is True.
Returns: tuple: Tuple containing the detected slow waves, their amplitudes and slopes, the mean and standard deviation of the amplitudes and slopes, and the number of detected waves.